
Summary
Understanding the cost of your customers and customer lifetime value can lead to increased ROI and sustainable growth for your B2B company. Discover how.
Evaluating the ROI of your marketing campaigns and customer acquisition efforts can be complex. Fortunately, a few metrics can be especially valuable in helping you track just how your efforts are working and how your marketing fits into your larger business strategy.
In a B2B environment, customer acquisition cost (CAC) and customer lifetime value (LTV) are both used frequently to evaluate marketing success. Each are helpful metrics in their own right; added together, they can provide a comprehensive ROI picture for your marketing and business.
So let's dig into these metrics. In this guide, we'll cover the basics of both CAC and LTV before exploring their relationship and how anyone, from novice marketers to advanced users, can leverage them in their own analytics and optimization efforts.
Just the Basics: What is CAC?

Short for customer acquisition cost, CAC is just that– a metric designed to determine the total "price" of acquiring an average customer. Calculating CAC over time allows marketers and organizations to measure how well their marketing is performing. A lower cost typically means that the messaging and channel strategy has increased in effectiveness, while a higher cost points to necessary improvements in optimizing marketing and messaging for the buyer's journey.
CAC is an intuitive metric in that it backs up and adds data points to common marketing assumptions: a well-functioning marketing program means messaging becomes more effective, requiring fewer touches from marketing and sales. A poorly targeted ad campaign, on the other hand, likely increases CAC as costs go up without customer rates rising at the appropriate rate.
Thus, tracking CAC over time becomes a core marketing optimization process. Multiple types of A/B testing on messaging and channels can lead to data-driven decisions that increase the effectiveness of the overall campaign over time. Channels with typically lower CAC, thanks to their lower implementation and media costs, can be tested against alternatives and within the context of a larger strategy to lower CAC.
Just the Basics: What is LTV?

Short for lifetime value or customer lifetime value, LTV calculates the total amount of revenue an average customer brings in while their account with your company is open. In other words, LTV calculates the "worth" of your typical customer as long as you can consider them your customer.
It's similar to other revenue-based metrics, but more nuanced in that it breaks down that revenue by the individual customer and accounts for how long the typical customer brings in revenue for your company. LTV can be applicable in almost every industry but is especially relevant in B2B environments where the average purchase frequency is relatively high and the average customer lifespan is longer.
The Core Relationship Between CAC and LTV

While they're separate metrics with their own individual use case, CAC and LTV almost always make the most sense when analyzed together. Combined, they look at both sides of the customer equation: the cost it takes to acquire them, as well as the revenue they're expected to generate.
To put it simply, CAC means more if you also know your average LTV. A $5,000 CAC sounds a lot more reasonable when the average customer account brings in $20,000 in revenue.
As a result, many marketers consider CAC and LTV in the context of the CAC:LTV Ratio. The ratio combines both metrics into one easy-to-measure KPI that allows you to benchmark against both your own past performance and industry averages and goals. To get there, you'll need to know how to calculate both your CAC and LTV. The goal, as described in more detail below, is to get to a LTV:CAC ratio of at least 3:1.
How to Calculate Your CAC
At its most simple, the CAC formula looks like this:
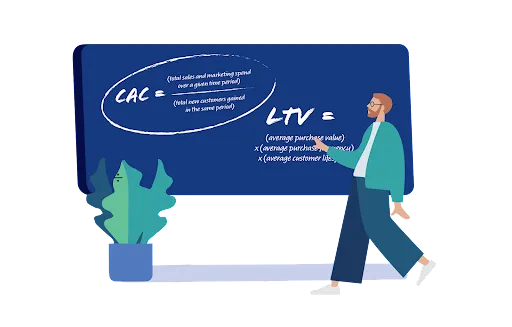
CAC = (total sales and marketing spend over a given time period) / (total new customers gained in the same period)

Plugging data into that formula requires a few things:
- The time period you want to analyze, which is typically a month, quarter, or year.
- The total number of customers gained in that time period, usually an easy number to get through your sales reports.
- The total sales and marketing spend in that time period.
That last variable is the most complex to include in this formula. It tends to include a few different types of costs, which are both directly and indirectly responsible for your marketing and sales success:
- Ad spend, which includes any funds spent on paid campaigns via digital or traditional channels if the brand is using paid media.
- Creative costs, which includes any funds spent on outsourced copywriting, graphic design, video production, etc.
- Software costs, which includes any funds spent on your CRM, email marketing software, reporting software, and other subscriptions related to your marketing and sales.
- Human costs, which includes the salary and employment-related costs of any employees in your company working on customer acquisition.
- Miscellaneous costs, which include any other budget items that have directly or indirectly been spent with the intent of acquiring customers, like a retreat or brainstorming session for your sales and marketing staff.
All of these costs need to be calculated for the given time period, then added together to become the numerator of the CAC formula. Fortunately, many of them (like software and human costs) remain relatively steady over time, making this calculation more straightforward when completed regularly.
How to Calculate Your LTV
LTV is more complex than CAC, because it largely depends on the type of business and revenue model of your business. That said, one general formula tends to work well in B2B environments due to their multi-year relationship with many customers:
LTV = (average purchase value) x (average purchase frequency) x (average customer lifespan)

Within that formula, you can calculate the individual variables as follows:
- Average purchase value requires dividing your annual total revenue by the number of total purchases in the same year.
- Average purchase frequency requires dividing the total number of annual purchases by the number of unique customers making purchases that year.
- Average customer lifespan requires averaging out the number of years your customer stays with your company.
For shorter customer lifecycles, which average around or less than a year, it helps to take the time period used in the variables above down to months. That allows you to get a more exact idea of how long customers tend to stay with you, and what value they offer your business in that time span.
How to Calculate Your LTV:CAC Ratio
Once you have determined both your CAC and LTV, getting to the comparative ratio is pretty straightforward. It's as simple as dividing your LTV by your CAC:
LTV:CAC Ratio = LTV / CAC

When calculated, the ratio becomes a vital benchmark to compare yourself against your own past history and your competition and provides insights into optimal spending for your future sales and marketing efforts. At the same time, it's important to remember that this ratio is a leading indicator. Predictions can change through your actions or external market forces, which means that this metric (like any other) should not be taken as gospel or the only data input.
Relevant Metrics and Benchmarks to Optimize Your CAC, LTV and LTV:CAC Ratio
Of course, calculating your LTV, CAC, and LTV:CAC ratio is only as valuable as your insights into what actually constitutes a good performance.
Let's start with the ratio. Most experts recommend a minimum 3:1 LTV:CAC ratio, which means that your average total revenue per customer should be at least three times the cost it took to acquire them. But your exact benchmark likely depends on your individual business situation and competitive environment.
Startups especially might need to spend more on marketing to break into the new market, raising their CAC and lowering their ratio in the process. In industries with high operating costs, like hospitality, a ratio of 4:1 may be closer to the norm to raise enough revenue in order to cover non-marketing overhead.
Finding benchmarks for the individual metrics making up that ratio is a bit more straightforward. Various studies have shown average CACs for specific industries, which range from $83 in manufacturing to $395 in software. Similar calculations exist for industry-specific LTV as well.
At the same time, of course, your exact metrics may still be different from these benchmarks. Every business situation is unique. That's why it's always best to start calculating these metrics, then use your own organization's performance as the benchmark for future performance.
CAC, LTV, and the LTV:CAC Ratio in Action
Time to bring the concept to life. Here's how a company might use CAC, LTV, and the LTV:CAC ratio in one of three scenarios: software, manufacturing, and ecommerce.
LTV and CAC Calculations in the Software Industry

Most B2B software now follows a recurring revenue subscription model. That simplifies the LTV equation a bit.
Say, for example, that the average monthly revenue per customer (also known as the average subscription value per customer) in your company is $100. You also know that your customers last, on average, 25 months.
Your LTV is $100 x 25 = $2,500.
Over the past year, you've spent $100,000 on a marketing campaign to gain new subscribers. Along with human, software, and miscellaneous costs, you discover that your total sales and marketing costs for the year have been $500,000, all to acquire 500 new subscribers.
Your CAC is $500,000 / 500 = $1,000.
Your LTV:CAC ratio, at 2.5:1, is just under the 3:1 general benchmark we mentioned above. Reducing marketing costs, or increasing the lifespan or average subscription value of your customers, can help you improve either side of the equation for a healthier ratio in the future.
LTV and CAC Calculations in the Manufacturing Industry

Manufacturing companies have to use the more traditional LTV formula. Let's say, for instance, that the average purchase value for the goods or parts you manufacture is $2,000. Your buyers tend to make 5 purchases a year and stay with you for around 5 years.
Your LTV is $2,000 x 5 x 5 = $50,000.
To get new customers, you ran an account-based marketing campaign that, in the past year, cost $100,000 including all related expenses from salaries to the required software. The campaign netted 10 new accounts.
Your CAC is $100,000 / 10 = $10,000.
Your LTV:CAC ratio is at 5:1, which is very healthy in any industry. Further optimizing it would likely require enticing your average account to stay with you for longer than 5 years.
LTV and CAC Calculations in the Ecommerce Industry

In ecommerce, volume is key. Chances are that your LTV is relatively low. If your average purchase is $30 and each customer tends to stay with you for a year and purchase 3 times…
Your LTV is $30 x 3 x 1 = $90.
To grow your business, you likely ran a multichannel digital ad campaign, and spent some money to optimize your website and shopping cart UX. All in all, the cost might have been $50,000, returning about 2,000 new customers in the past year.
Your CAC to 50,000 / 2,000 = $25.
Your LTV:CAC ratio, at 3.6:1, is healthy. It can still use some improvement, likely achieved by increasing your customer value through loyalty programs or checkout promotions.
Leveraging the LTV:CAC Ratio by Channel

So far, we've only considered the core metrics discussed throughout this guide as comprehensive methods to evaluate your sales and marketing efforts. Let's break it down some more. Advanced users can get even more value out of these concepts by applying them on a per-channel basis.
The LTV:CAC ratio can be an especially vital KPI when evaluating the success of your individual marketing channels. For example, you can determine exactly how much it costs to acquire a new customer via paid search and how much revenue customers acquired via that tactic can bring to your organization. Then, compare the ratio to that of other channels like paid social, organic social, organic web traffic, SEO, and referrals to see which channels are worth investing in and which might be possible to de-prioritize.
As with overarching business benchmarks, channel-specific CAC benchmarks can also be immensely valuable in helping you determine whether or not a given tactic is worth implementing.
Say, for example, that your paid social media strategy is not returning a healthy ratio because its CAC is comparatively high. It might be time to rework your execution, such as switching your ad campaign to a different channel with a lower CPC or optimizing your creative. If, on the other hand, the LTV is low, you might need to optimize targeting to a more relevant audience.
And of course, adjustments that don't lead to an actual improvement in the metrics are a sign that the channel might simply not be effective for your company.
The goal when breaking down your LTV:CAC ratio by individual marketing channels is to continually optimize your strategy both within those channels and towards the channels that are performing best. That, in turn, can help you raise the overall ratio, ultimately benefiting your entire marketing strategy and execution.
How Data Strategy Plays Into the CAC:LTV Equation

Building your CAC and LTV analytics, especially when breaking it down into channels-specific insights, is a noble goal. But, as with so many other aspects of marketing, it can only be successful when the right data infrastructure is in place to make the numbers that lead to your reporting, decisions, and optimizations accurate.
It all starts with attribution. You have to know where your leads are coming from, including a move towards multi-touch attribution. After all, in modern marketing, your channels are inextricably intertwined. Being able to tell leads apart based on the channels responsible for generating them is the only way to report on any kind of channel-specific ROI metrics.
The same concept also holds true for the entire sales funnel. Tracking your lead conversion rates, for instance, is key to understanding just how many new customers a given channel has been able to generate. Meanwhile, monetary goal conversion attributions can help you determine exactly how much the average sale is worth to your company.
Finally, you need to find a place to track all of this information and data. That makes the right CRM a crucial piece of building your ROI calculations through the LTV:CAC ratio. The more you're able to keep all your data in one, easily-reportable place, the more easily you'll be able to both draw insights from it and act on those insights to improve your marketing and grow your business.
Ready to Optimize Your CAC, LTV, and Marketing Efforts?

There's a reason CAC, LTV, and the LTV:CAC ratio have become such crucial ROI metrics across industries in recent years. The increasing ability to truly attribute and calculate marketing spends and their impact on new customers and revenue allows businesses to track these metrics and make more informed decisions in the process.
Of course, the process itself is still complex. You might not feel comfortable doing it on your own.
Fortunately, you don't have to. With the right partner, you can get an easy headstart into these complex metrics. At Steel Croissant, we can help you better understand your lead generation efforts, sift through your customer data, and implement or optimize your CRM to make better investment decisions for your marketing program. Contact us today to start the conversation!
FAQs
Our SEO course offers comprehensive support and resources during and after the course. Experienced experts teach the course, and we provide access to a team of developers, social media managers, and UX designers for extra support. We maintain a supportive relationship with participants by staying in contact, providing ongoing support, and sharing the latest trends and techniques in SEO. Our goal is to equip marketers with the tools they need to succeed.


%20in%202025.png)
